
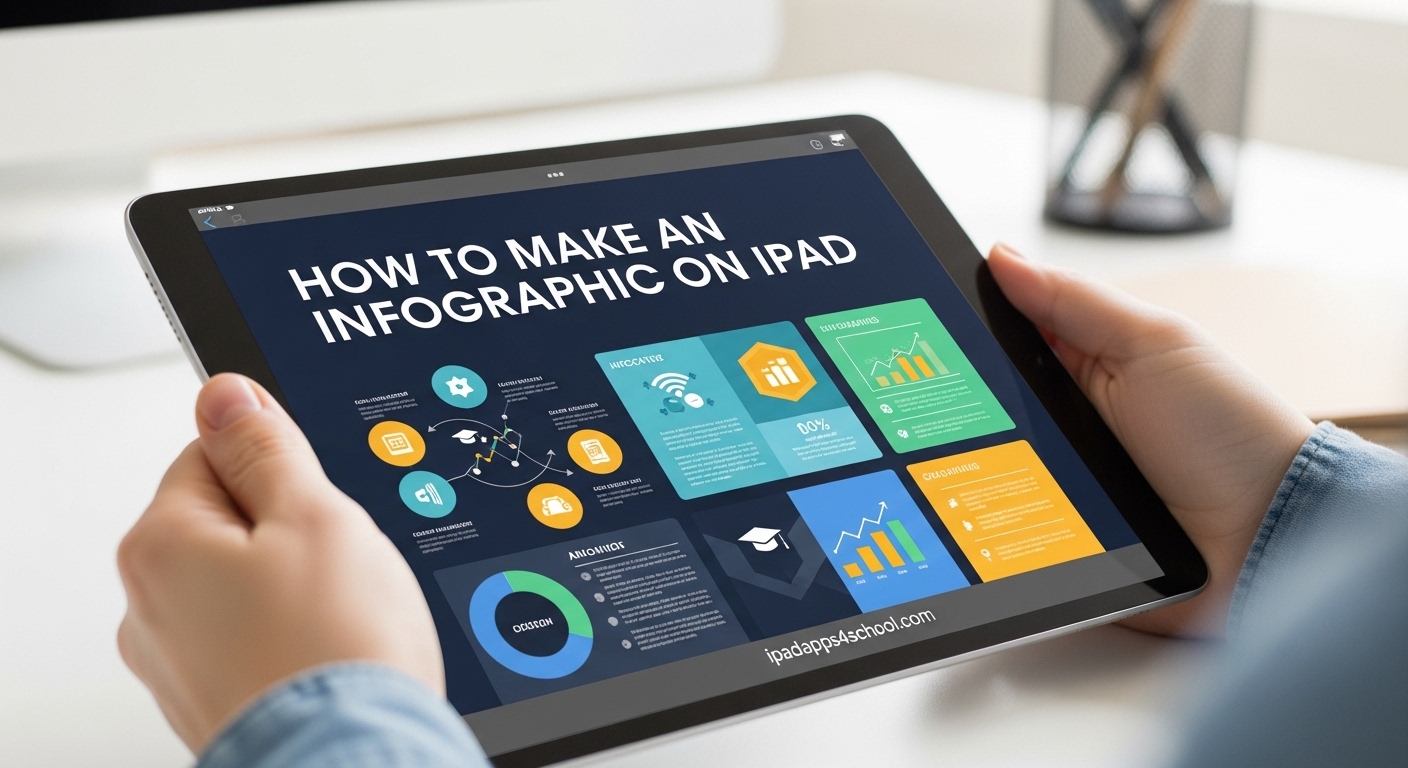
Creating infographics on your iPad is easier than you might think. Whether you are a student working on a classroom project or a teacher preparing visual materials, your iPad has everything you need to design professional-looking infographics.
To make an infographic on iPad, you need three things: the right app, a clear data story, and basic design principles. This guide walks you through the entire process from choosing software to exporting your finished creation.
Yes, you can absolutely do graphic designing on an iPad. Modern iPad apps rival desktop software for creating charts, illustrations, and data visualizations. With Apple Pencil support and powerful native apps, the iPad has become a legitimate tool for professional design work.
Table of Contents
How to Make an Infographic on iPad
The easiest way to create an infographic on iPad is to use a dedicated design app with templates. Start by selecting an app like Canva or Keynote, choose a template that fits your data, customize the colors and text, add your data visualizations, and export in your preferred format.
This seven-step process works for any type of infographic. Whether you are visualizing survey results, explaining a process, or comparing statistics, following these steps will give you consistent results.
Best Apps for Making Infographics on iPad
Choosing the right app depends on your skill level and budget. Here are the top options that work well for students and educators.
Canva: Best Free Option
Canva offers thousands of infographic templates specifically designed for iPad. The free version includes most features students need. You can drag and drop elements, customize colors, and export in multiple formats.
The iPad app supports Apple Pencil for sketching custom elements. Canva also syncs across devices, so you can start on iPad and finish on the web.
Keynote: Best Native Apple Solution
Keynote is free on every iPad and surprisingly powerful for infographic creation. The shapes library, chart tools, and animation features make it ideal for educational presentations.
Keynote excels at animated infographics. You can use the line-draw animation to make charts appear hand-drawn, which engages audiences during presentations.
Procreate: Best for Hand-Drawn Style
If you want a hand-crafted look, Procreate is worth the one-time purchase. With Apple Pencil, you can draw custom charts, icons, and illustrations that stand out from template-based designs.
Procreate requires more design skill but gives you complete creative freedom. It is popular among students in art and design programs.
Affinity Designer: Best Professional Option
Affinity Designer is a one-time purchase alternative to Adobe Illustrator. It offers vector-based design tools perfect for scalable infographics that print crisply at any size.
This app has a steeper learning curve but provides professional-grade features. Users on forums consistently recommend it over subscription-based alternatives.
Icograph: Specialized Infographic Tool
Icograph is built specifically for infographics and data visualization. It includes pre-made chart types and map templates that save time when working with geographic data.
Free vs Paid App Comparison
Free apps like Canva and Keynote handle most student projects perfectly. Paid apps become worth it if you create infographics regularly or need advanced export options like vector files.
Keynote stands out because it is completely free with no premium tiers. Canva limits some templates and export formats on the free plan. Procreate and Affinity Designer require upfront payment but have no ongoing subscriptions.
Step-by-Step Tutorial: Creating Your First Infographic
Now let us walk through the actual creation process using Canva or Keynote as examples. These steps work for any app with minor adjustments.
Step 1: Choose Your App and Template
Open your chosen app and browse infographic templates. Look for layouts that match your data type. Timeline data works best with horizontal layouts. Comparison data fits side-by-side designs.
Starting with a template saves hours compared to building from scratch. You can always customize colors, fonts, and layouts later.
Step 2: Set Up Your Canvas Size
Choose dimensions based on how you will share the infographic. Social media posts typically use 1080 by 1080 pixels. Print documents need higher resolution, usually 300 DPI.
For classroom presentations, match your canvas to standard slide dimensions. This makes importing into other projects seamless.
Step 3: Add Charts and Data Visualizations
Import or create charts that represent your data accurately. Pie charts work for percentage data. Bar charts compare quantities across categories. Line charts show trends over time.
Keep charts simple. One chart should communicate one idea. Avoid 3D effects that distort data perception.
Step 4: Incorporate Icons and Graphics
Add icons that reinforce your message visually. Most apps include icon libraries. Search for terms related to your topic and choose simple, recognizable symbols.
Limit yourself to one icon style throughout. Mixing flat icons with detailed illustrations looks unprofessional.
Step 5: Add Text and Labels
Write clear headlines and brief explanatory text. Infographics should tell a story at a glance. Use the headline-hierarchy: main title, section headers, then body text.
Keep text minimal. If a sentence does not add information, delete it. Labels near charts should explain what the data represents.
Step 6: Apply Colors and Styling
Choose a color scheme with 2-3 main colors plus neutral tones. Use contrasting colors to highlight important data points. Ensure text remains readable against background colors.
Consistency matters. Use the same color for all related data points. For example, if blue represents your school in one chart, use blue for school data in every chart.
Step 7: Review and Export
Check your infographic on different screen sizes. Text that looks fine on iPad might be too small when shared. Ask someone else to review for clarity.
Export in multiple formats. PNG works for web and social media. PDF preserves quality for printing. Some apps offer SVG export for scalable graphics.
Apple Pencil Techniques for Hand-Drawn Infographics
The Apple Pencil transforms infographic creation. Here is how to use it effectively for custom designs.
Creating Custom Charts with Apple Pencil
In Procreate or Keynote, draw your own bar charts or pie slices freehand. The slight imperfections make data feel approachable and human. Use the ruler tool in Procreate for straight lines.
Duplicate drawn elements to maintain consistency. Draw one bar, then copy and resize for others in the chart.
Hand-Drawn Icons and Illustrations
Simple icons drawn with Apple Pencil add personality. Practice drawing basic shapes: circles for people, triangles for arrows, rectangles for buildings. Build complex icons from simple components.
Use pressure sensitivity for line variation. Light pressure for details, heavy pressure for bold outlines.
Combining Digital and Hand-Drawn Elements
The best infographics mix both styles. Use digital templates for structure and hand-drawn elements for highlights. This approach saves time while maintaining personality.
Export hand-drawn elements as transparent PNG files. Import them into Canva or Keynote as custom graphics.
Design Tips for Effective Infographics
Good design separates professional-looking infographics from amateur attempts. Follow these principles.
Color Scheme Selection
Start with one dominant color representing your topic or brand. Add one accent color for highlights. Use neutral grays for backgrounds and secondary text.
Tools like Coolors.co help generate harmonious color palettes. Most design apps let you save custom color schemes for reuse.
Typography Best Practices
Limit fonts to two: one for headlines and one for body text. Sans-serif fonts like Helvetica or Arial work best for digital infographics. Ensure minimum 12-point font size for readability.
Establish clear size hierarchy. Headlines should be noticeably larger than body text. Consistent sizing helps readers scan quickly.
Data Visualization Dos and Don’ts
Do start bar charts at zero to avoid distorting comparisons. Do label all axes clearly. Do use consistent scales when comparing multiple charts.
Do not use pie charts for more than five categories. Do not use 3D effects that obscure data. Do not add unnecessary decorations that distract from information.
Layout and Spacing Tips
White space improves readability. Do not crowd elements together. Group related information visually using boxes or background colors.
Follow a clear reading path. In Western languages, readers scan left to right, top to bottom. Place important information accordingly.
Common Mistakes to Avoid
Information overload kills infographics. If you have too much data, create multiple infographics or simplify. Remember: one infographic, one message.
Low-resolution images look unprofessional. Use vector graphics or high-resolution PNG files. Test print quality before finalizing.
Creating Animated Infographics with Keynote
Animated infographics engage audiences more than static images. Keynote makes animation accessible to everyone.
Line-Draw Animation Technique
Select any shape or chart in Keynote. Open the Animation panel and choose Line Draw. Your element will animate as if being drawn in real time.
This technique works perfectly for explaining processes step by step. Each element appears exactly when you discuss it.
Magic Move Transitions
Magic Move automatically animates changes between slides. Duplicate a slide, move elements, and Keynote animates the transition. This creates smooth transformations perfect for data comparisons.
Use Magic Move to show before-and-after scenarios or changing data over time.
Export as Video or GIF
Export animated Keynote presentations as video files. Use these in other projects or upload to social media. MP4 format works universally.
For shorter animations, export as GIF for easy web embedding. Keep GIF file sizes under 5MB for fast loading.
Export and Share Your Infographic
The final step is getting your infographic where it needs to go. Here is how to optimize for different uses.
Best Formats for Different Uses
Use PNG for social media and websites. It preserves quality with transparency support. Use PDF for print documents and presentations. PDF maintains vector quality at any size.
JPEG works for photos within infographics but avoid it for text-heavy designs. Compression reduces readability.
Print vs Digital Optimization
Print requires higher resolution: 300 DPI minimum. Digital works fine at 72 or 150 DPI. RGB color mode works for screens. CMYK mode is necessary for professional printing.
Most iPad apps export RGB by default. Convert to CMYK using online tools if professional printing is required.
Sharing to Social Media
Each platform has optimal dimensions. Instagram prefers square images. Twitter cards work best at 1200 by 675 pixels. LinkedIn posts accept various sizes but 1200 by 1200 works well.
Save platform-specific versions rather than posting the same file everywhere. Optimization ensures your infographic looks its best.
AirDrop and Cloud Options
AirDrop moves files instantly between Apple devices. Use it to transfer infographics from iPad to Mac for advanced editing. Cloud storage like iCloud Drive or Google Drive enables access from any device.
Create a shared folder for group projects. Team members can collaborate on infographics without version conflicts.
FAQ
What is the easiest app to make an infographic?
Canva is the easiest app for beginners. It offers thousands of drag-and-drop templates specifically designed for infographics. The free version includes enough features for most student and educational projects.
Can I do graphic designing on an iPad?
Yes, the iPad supports professional graphic design work. Apps like Canva, Procreate, Affinity Designer, and Keynote provide powerful design tools. Apple Pencil adds precision for drawing and illustration tasks.
What is the easiest way to create an infographic?
The easiest way is using a template-based app like Canva or Keynote. Start with a pre-designed template, replace placeholder text with your data, customize colors to match your style, and export. This process takes under 30 minutes for simple infographics.
Can ChatGPT create an infographic?
ChatGPT cannot directly create visual infographics. It can help write content, suggest data points, and describe layouts. You then use design apps like Canva or Keynote to create the actual visual infographic based on ChatGPT’s text suggestions.
Conclusion
You now know how to make an infographic on iPad from start to finish. Start with Canva or Keynote if you are new to design. Experiment with Apple Pencil in Procreate for hand-drawn styles. Remember to keep your message clear, your design simple, and your data accurate.
The best way to improve is practice. Create a simple infographic this week using the seven-step process outlined above. Share it with classmates or colleagues and gather feedback. Each project builds your skills for the next one.
Your iPad is a powerful design tool. With the right apps and these techniques, you can create infographics that communicate ideas clearly and look professionally designed.